
Breakout trading strategy
March 19, 2026 at 7:35 PM
Breakout trading is a popular trading strategy that involves identifying points where the price of an asset breaks through a significant level of support or resistance, and entering a trade in the direction of the breakout. The theory behind breakout trading is that when an asset's price breaks through a significant level of support or resistance, it is likely to continue moving in that direction.
Here are some potential trading methodologies utilized by those employing a breakout trading strategy:
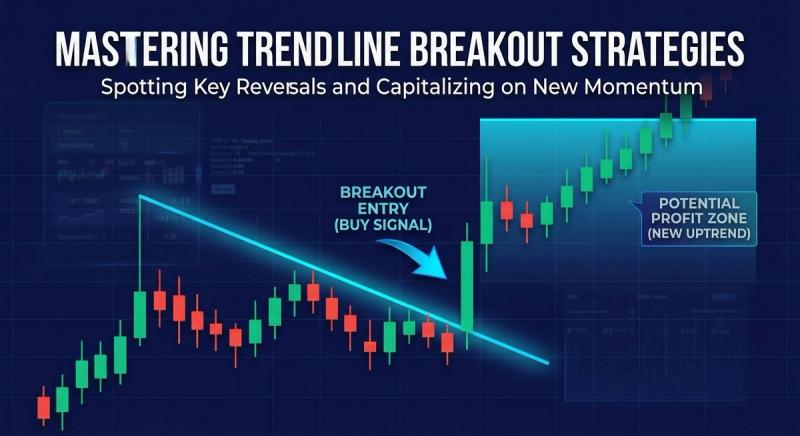
A hypothetical trend line breakout scenario
Trend line breakout: A trend line is a line that connects two or more significant highs or lows in an asset's price history. When the price of the asset breaks through the trend line, it is a signal to enter a trade in the direction of the breakout. For example, if the trend line is sloping upward and the price breaks through it to the upside, it is a signal to buy the asset.
Key level breakout: A key level is a significant level of support or resistance that has been tested multiple times in an asset's price history. When the price of the asset breaks through the key level, it is a signal to enter a trade in the direction of the breakout. For example, if the asset has been trading in a range between $50 and $60, and it breaks through the $60 level to the upside, it is a signal to buy the asset.
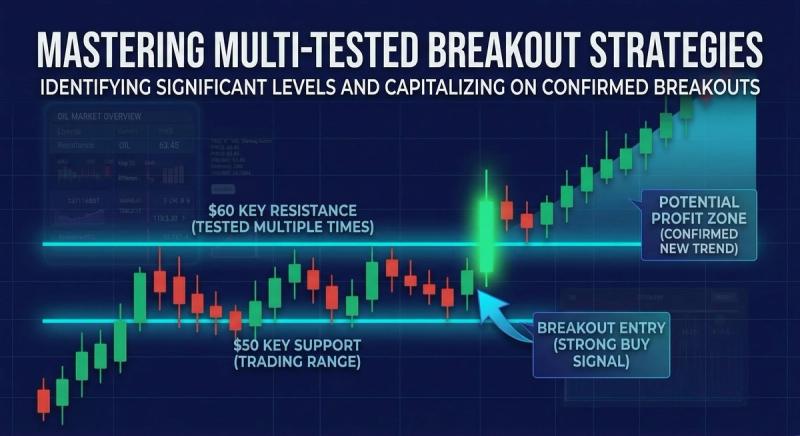
Breakout through a level that has been tested on multiple occasions
Moving average crossover breakout: A moving average is a line that shows the average price of an asset over a specified time period. When the price of an asset crosses above a moving average line, it is a signal to enter a trade in the direction of the breakout. For example, if the price of an asset crosses above a 50-day moving average, it is a signal to buy the asset.
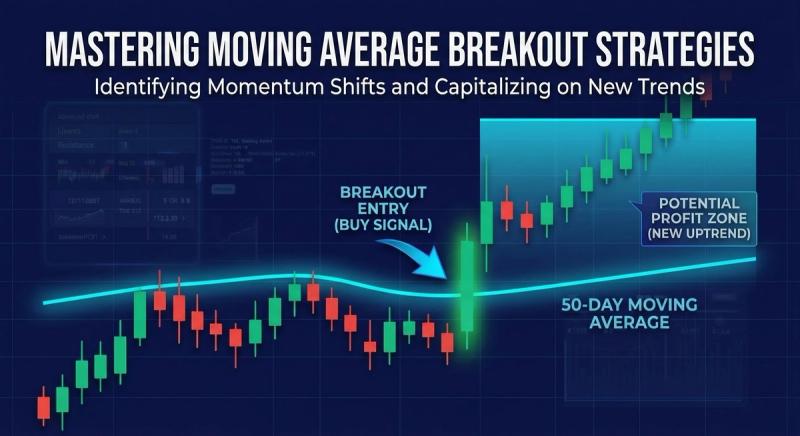
A prospective moving average breakout scenario
Volume breakout: Volume is a measure of how much trading activity is occurring in an asset. When the price of an asset breaks through a significant level of support or resistance, and the volume of trading activity increases significantly, it is a signal to enter a trade in the direction of the breakout. For example, if the price of an asset breaks through a key level and the volume of trading activity increases significantly, it is a signal to buy the asset.
Breakout pullback: A breakout pullback strategy involves waiting for a price breakout, and then waiting for a pullback to a significant level of support or resistance before entering a trade in the direction of the breakout. For example, if the price of an asset breaks through a key level of resistance and then pulls back to retest that level as support, it is a signal to buy the asset.
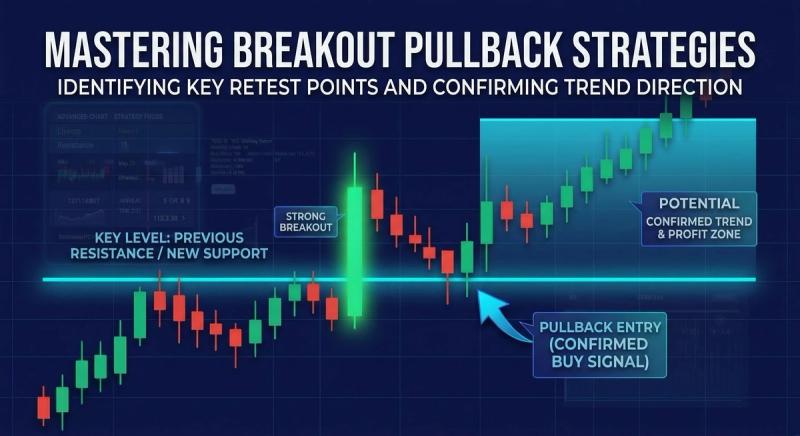
A prospective breakout followed by a pullback scenario
It is important to note that breakout trading involves taking positions in the direction of a significant price movement, and can be a high-risk strategy. Traders must carefully manage their risk and be disciplined in their trading decisions. Additionally, traders must have a good understanding of the assets they are trading and be able to identify significant levels of support and resistance and appropriate stop loss and take profit levels.
This material is a marketing communication provided for informational purposes only and does not constitute investment advice, recommendation, or an offer or solicitation to trade. Any market analysis, opinions, or forecasts are based on publicly available information and do not constitute independent investment research. Past performance and forecasts are not reliable indicators of future results. Scope Markets accepts no liability for any loss arising from reliance on this information.
Related Articles

Anatomy of candlestick charts, patterns, and formations: Part 3
By Joshua Mahony
If you haven’t already familiarised yourself with the first two articles of the Japanese candlestick patters series, have a read of part one with sing...
Read More
Trading Academy
Japanese candlesticks
Chart Patterns
Technical Analysis
Support And Resistance
Candlestick charts

Anatomy of candlestick charts, patterns, and formations: Part 2
By Joshua Mahony
This is the second part of our comprehensive guide to reading Japanese candlestick chart patterns. If you would like to start with the first part, our...
Read More
Trading Academy
Japanese candlesticks
Chart Patterns
Technical Analysis
Candlestick Patterns
Support And Resistance

Anatomy of candlestick charts, patterns, and formations: Part 1
By Joshua Mahony
Candlesticks charts are the most popular for technical analysts in financial markets, with many utilising candles alone to inform their trading decisi...
Read More
Trading Academy
Japanese candlesticks
Candlestick Patterns
Charts
Technical Analysis
Chart Patterns

A comprehensive guide to trading the news
By Joshua Mahony
As a trader, you will come across plenty of volatile moments as breaking economic or political announcements swing market sentiment. While technical t...
Read More
Trading Academy
News Trading
Fundamental Analysis
Market Volatility
Trading Strategies
Market Sentiment